
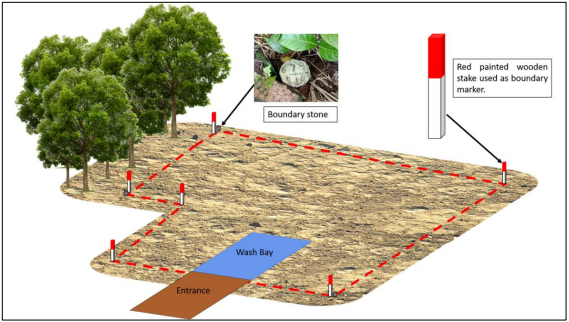
Figure 1: Illustration of site boundary marking.
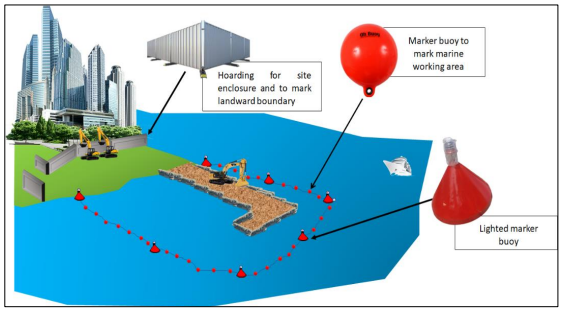
Figure 2: Illustration of sea boundary marking.

Figure 3: Illustration showing site boundary marking and buffer for a hill site.

Figure 4: Illustration showing site boundary marking and buffer for sensitive or protected areas.
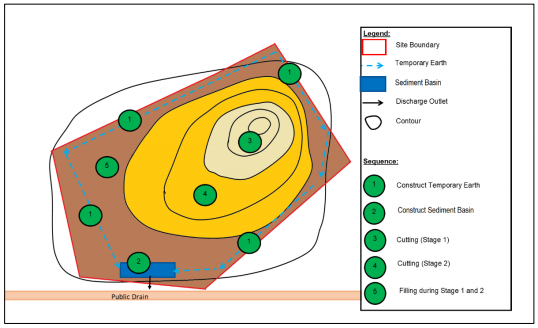
Figure 5: Illustration of earthwork activity by stages.
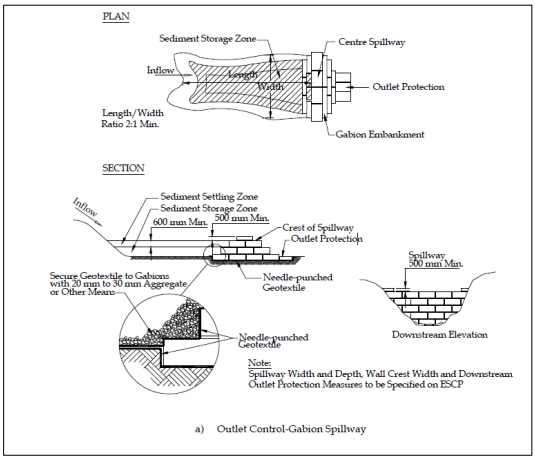
Figure 6: Typical design of a Sediment Basin (1).

Figure 7: Typical design of a Sediment Basin (2).
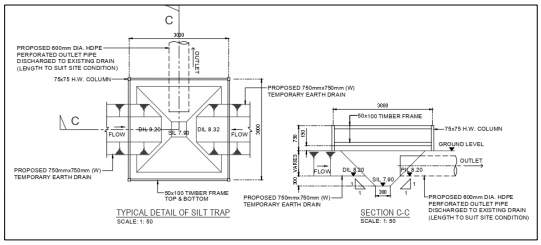
Figure 8: Typical design of a Silt Trap.
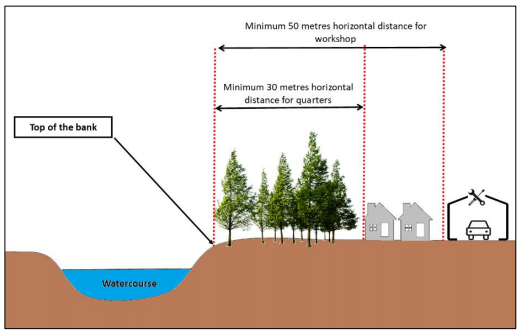
Figure 9: Illustration showing the measurement of the horizontal distance between the workers’ quarters and workshop and the top of the bank.

Figure 10: Illustration of overburden dumping stages.
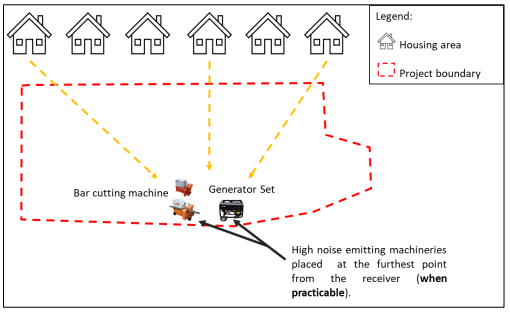
Figure 11: Illustration showing the allocation of the noise source from probable receivers.
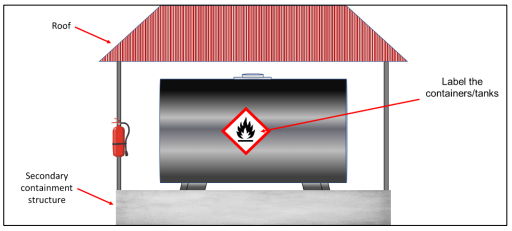
Figure 12: Illustration of an oil materials storage area.

Figure 13: Illustration of a secondary containment structure and its

Figure 14: Typical design of an oil trap.
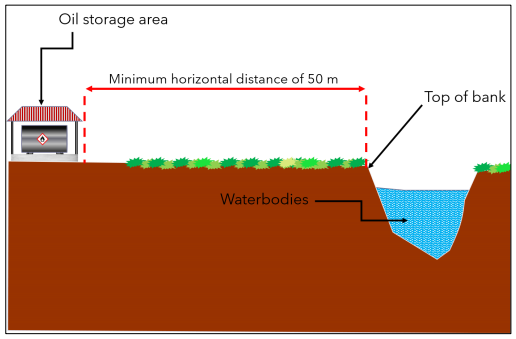
Figure 15: Illustration showing measurement of the horizontal distance between the oil storage area and the top of the bank.
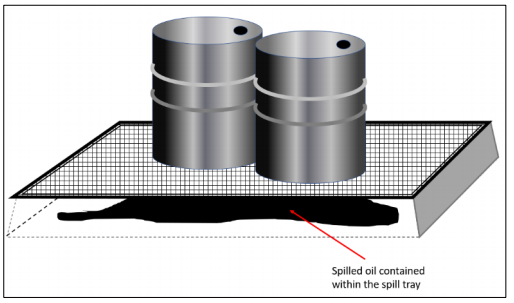
Figure 16: Illustration of a spill tray for non-permanent oil containers.

Figure 17: Illustration showing measurement of horizontal distance between the waste collection facility and the top of the bank.
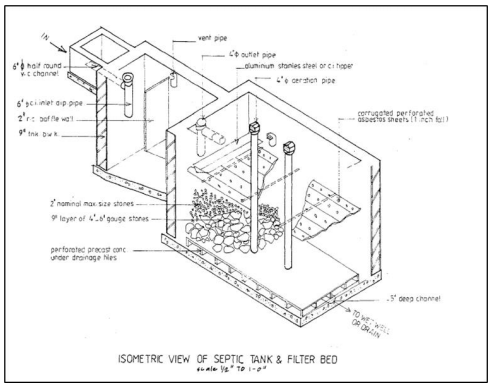
Figure 18: Typical diagram for a Septic Tank.
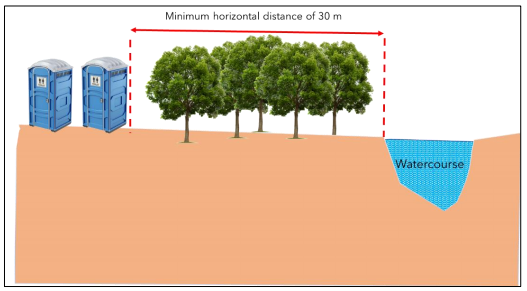
Figure 19: Illustration showing measurement of horizontal distance between toilet facilities and watercourses.
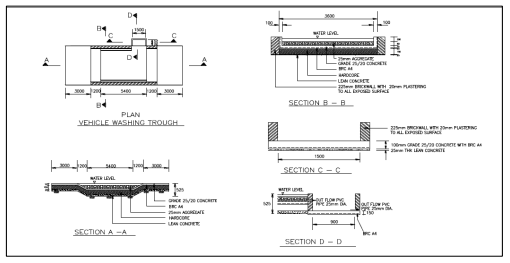
Figure 20: Typical design of a wash through (rural area).
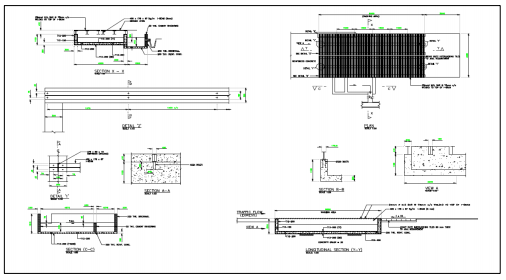
Figure 21: Typical design of a wash through (urban area).